6G Testbed and AI Traffic Characterization
An open-source framework for measuring and analyzing how AI and LLM services consume the network. I lead this project within the 5G-MAG Reference Tools effort, and it directly feeds the 3GPP SA4 study on 6G media by providing reproducible measurements of AI traffic under realistic, standards-aligned network conditions.
Source code: github.com/5G-MAG/6G-Testbed
Why it exists
AI is becoming a first-class network workload. Chatbots, agentic tools, image generation, and real-time voice all stress the network in ways that classic video and web traffic models do not capture. To design 6G media transport properly, 3GPP SA4 needs hard data: how much AI services upload and download, how token streaming behaves under delay and loss, and where the network becomes the bottleneck for user experience. The testbed produces exactly that data, in a form that can be cited and reproduced in standardization contributions.
The rest of this page describes the system first - its architecture, the workloads it drives, the network conditions it emulates, and the metrics it records - and then presents the measured results and what they imply for 6G design.
Architecture
The framework has two cooperating packages plus a capture-and-analysis stack:
- aitestbed - the orchestration and measurement layer. It runs AI traffic experiments end to end, drives real provider APIs, applies network conditions, and collects telemetry into SQLite with a structured metric schema.
- netemu - a network-emulation library that wraps Linux traffic control (
tcandnetem) to apply reproducible delay, loss, jitter, and rate constraints, including asymmetric uplink and downlink shaping.
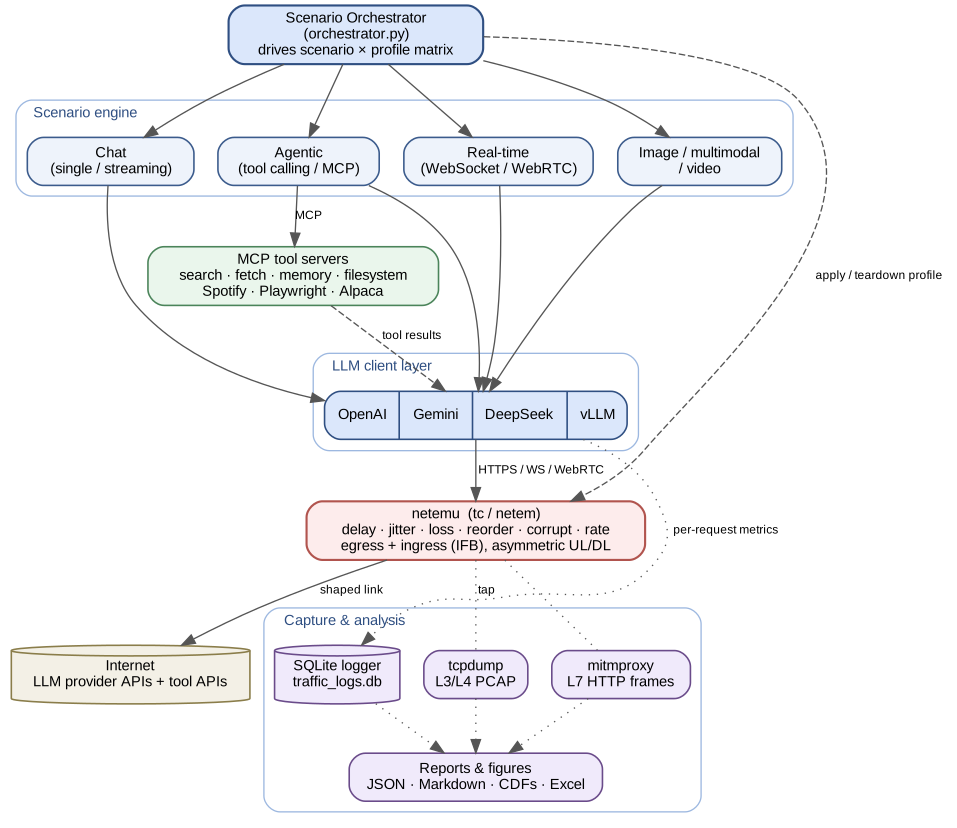
Figure: end-to-end architecture of the aitestbed component. The orchestrator walks the scenario × profile matrix, driving workloads through provider-specific LLM clients and MCP tool servers. All traffic crosses the netemu shaping layer (tc/netem) before reaching the public LLM and tool APIs. A capture stack taps the shaped path at layer 3/4 (tcpdump) and layer 7 (mitmproxy) and lands per-request metrics in SQLite for reporting.
Components
- Scenario orchestrator (
orchestrator.py) - the control plane. It walks the scenario × profile test matrix, sets up and tears down each run, applies the network profile, starts and stops capture, and can resume interrupted campaigns from the results database. - Scenario engine - the workload generators: chat (single and streaming), agentic tool-calling over MCP, real-time WebSocket/WebRTC voice and text, image generation, and multimodal/video understanding.
- LLM client layer - provider-specific clients for OpenAI, Google Gemini, DeepSeek, and self-hosted vLLM, instrumenting every request with timing, token counts, and byte volumes.
- MCP tool servers - Model Context Protocol servers (web search, fetch, memory, filesystem, Spotify, Playwright, Alpaca market data) grouped by workflow. Agentic scenarios call them, and their traffic is shaped like any other flow.
- netemu (
tc/netem) - applies reproducible delay, jitter, loss, reordering, corruption, and bandwidth limits to both egress and ingress (via an IFB device), including asymmetric uplink/downlink shaping for the satellite profiles. - Capture and analysis -
tcpdumprecords L3/L4 PCAPs,mitmproxyoptionally records L7 request/response frames, and a SQLite logger stores per-request records (bytes, tokens, TTFT/TTLT, status). A post-processing pipeline aggregates these into JSON, Markdown, figures, and an Excel workbook.
End-to-end flow. For each scenario × profile combination: netemu installs the profile's shaping rules → capture starts → the orchestrator runs the scenario, which drives an LLM client (and, for agents, the MCP servers) whose traffic crosses the shaped interface to the real provider and tool APIs → per-request metrics are written to SQLite → capture stops and the shaping is torn down. Once the full matrix completes, the analysis pipeline produces the aggregated reports and figures.
Scenarios
The scenario engine covers 11 scenario types that represent how people and agents actually use AI services:
- Chat, including streaming token responses
- Agentic AI driving tools over the Model Context Protocol (MCP)
- Image generation
- Multimodal queries
- Video understanding
- Real-time interaction over WebSocket and WebRTC
Supported providers include OpenAI, Google Gemini, DeepSeek, self-hosted vLLM, and the OpenAI Realtime API.
Network profiles
Emulation profiles mirror 3GPP reference conditions and include 5QI mappings, for example:
- 6g_itu_hrllc: 1 ms delay, ultra-low-latency reference conditions
- 5g_urban: 20 ms delay with 0.1% loss, mainstream cellular
- satellite_leo and satellite_geo: asymmetric satellite links with directional parameters
- cell_edge and congested: degraded network states
- 5qi_7 and 5qi_80: voice and streaming, and low-latency eMBB variants
The profiles align with the reference conditions in 3GPP SA4 contribution S4-260848.
Metrics
Each run collects more than 60 AI-specific metrics, including:
- Time-to-first-token (TTFT) and time-to-last-token (TTLT)
- Time-per-output-token and token generation rates
- Latency percentiles across runs
- Upload and download volumes and their ratio
- Agent loop performance for tool-calling workloads
Getting started
The testbed targets Python 3.10+ on Linux with iproute2, and is Docker-ready with the NET_ADMIN capability. A basic experiment looks like:
pip install -e netemu
pip install -r aitestbed/requirements.txt
cd aitestbed
python orchestrator.py --scenario chat_basic --profile 5g_urban --runs 10
For full SA4 validation campaigns, the orchestrator can run the complete matrix of scenarios and network profiles with PCAP capture and automated report generation.
Measured results
The result archive covers the complete set of executed scenarios, rather than only the focused A2A and OpenClaw studies. The main campaign contains 14,355 raw records across 23 scenarios. Its scenario/profile reliability matrix covers 13,057 mapped attempts, of which 12,602 succeeded (96.5%). Follow-on campaigns add deeper measurements for agent discovery, multimodal analysis, A2A signaling, and the OpenClaw assistant pipeline.
| Result set | Records | Scenarios | Profiles | Observed success |
|---|---|---|---|---|
| Full scenario matrix | 14,355 raw | 23 | Up to 10 | 12,602 / 13,057 mapped (96.5%) |
| Agent and tool discovery | 241 | 8 | 1 | 229 / 241 (95.0%) |
| Latest L7 multimodal run | 60 | 1 | 10 | 60 / 60 (100%) |
| A2A protocol workloads | 397 | 3 | 10 | 99.0% |
| Full agent pipeline (OpenClaw) | 100 | 1 | 10 | 100.0% |
The follow-on campaigns overlap some scenario names in the full matrix, so their record counts are reported separately and should not be added into one grand total.
Full scenario matrix
The tables below report every scenario in the archived full-suite analysis. Traffic values are median application-layer request/response bytes. TTFT shows the observed median time to first token without emulation and under the congested profile where that aggregate is available.
Chat, search, and inference
| Scenario | Mapped attempts | Success | Median request / response | TTFT: baseline to congested |
|---|---|---|---|---|
| Basic chat | 300 | 100% | 3.5 KB / 5.2 KB | Not archived |
| Streaming chat | 300 | 100% | 5.9 KB / 543 KB | 6.14 s to 10.10 s |
| Gemini chat | 200 | 100% | 2.4 KB / 92.7 KB | 4.60 s to 5.40 s |
| DeepSeek chat | 300 | 100% | 1.9 KB / 4.1 KB | Not archived |
| DeepSeek streaming | 299 | 99.3% | 6.9 KB / 685 KB | 0.73 s to 2.44 s |
| DeepSeek coder | 295 | 98.6% | 6.8 KB / 1.13 MB | 0.74 s to 2.47 s |
| DeepSeek reasoner | 297 | 99.3% | 9.4 KB / 1.09 MB | 4.68 s to 8.09 s |
| Direct web search | 200 | 100% | 5.2 KB / 144 KB | Not archived |
| Direct web search, DeepSeek | 390 | 2.6% | 5.2 KB / 140 KB | Not archived |
| Self-hosted vLLM chat | 300 | 100% | 2.9 KB / 295 KB | 0.24 s to 2.63 s |
Real-time and multimodal media
| Scenario | Mapped attempts | Success | Median request / response | TTFT: baseline to congested |
|---|---|---|---|---|
| Real-time text | 300 | 100% | 224 B / 1.26 MB | 0.24 s to 0.69 s |
| Real-time interactive | 500 | 100% | 193 B / 417 KB | 0.20 s to 0.77 s |
| Real-time technical | 396 | 100% | 206 B / 1.03 MB | 0.20 s to 0.81 s |
| Real-time multilingual | 400 | 100% | 210 B / 1.34 MB | 0.23 s to 0.70 s |
| Real-time audio | 300 | 100% | 104 KB / 699 KB | 2.63 s to 4.90 s |
| Real-time audio over WebRTC | 300 | 100% | 77.4 KB / 65.0 KB | 1.58 s to 1.62 s |
| Real-time text over WebRTC | 198 | 100% | 209 B / 77.8 KB | 0.010 s to 0.001 s |
| Image generation | 300 | 100% | 133 B / 1.75 MB | Not archived |
| Multimodal analysis | 400 | 100% | 14.2 KB / 16.9 KB | Not archived |
| Video understanding, self-hosted vLLM | 100 | 100% | 1.32 MB / 1.4 KB | Not archived |
Agents and data tools
| Scenario | Mapped attempts | Success | Median request / response |
|---|---|---|---|
| Computer-control agent | 2,303 | 100% | 238 B / 1.9 KB |
| Playwright web test | 2,933 | 97.7% | 3.1 KB / 863 B |
| Trading market data | 1,746 | 99.9% | 74.4 KB / 872 B |
Agent and tool discovery campaign
This separate 241-run validation exercised eight multi-tool workflows under one network profile.
| Scenario | Records | Success | Mean latency |
|---|---|---|---|
| Exa research | 30 | 96.7% | 38.74 s |
| Maps route planning | 32 | 100% | 21.63 s |
| Playwright web test | 38 | 94.7% | 13.37 s |
| Shopping agent | 44 | 81.8% | 19.15 s |
| Trading market data | 27 | 100% | 20.81 s |
| Twilio emergency notification | 2 | 100% | 0.01 s |
| Weather risk assessment | 25 | 100% | 20.20 s |
| Weather route planning | 43 | 97.7% | 27.85 s |
The latest dedicated L7 multimodal campaign added 60 successful runs across 10 profiles, with 18.48 seconds mean end-to-end latency.
Key result figures
The figures below summarize the headline results across all scenarios and network profiles. They are produced by the testbed's reporting pipeline from the same measured data as the tables above. The leading figures cover the core transport metrics (latency, burstiness, TTFT, TTLT, and uplink/downlink ratio); the remaining figures follow.
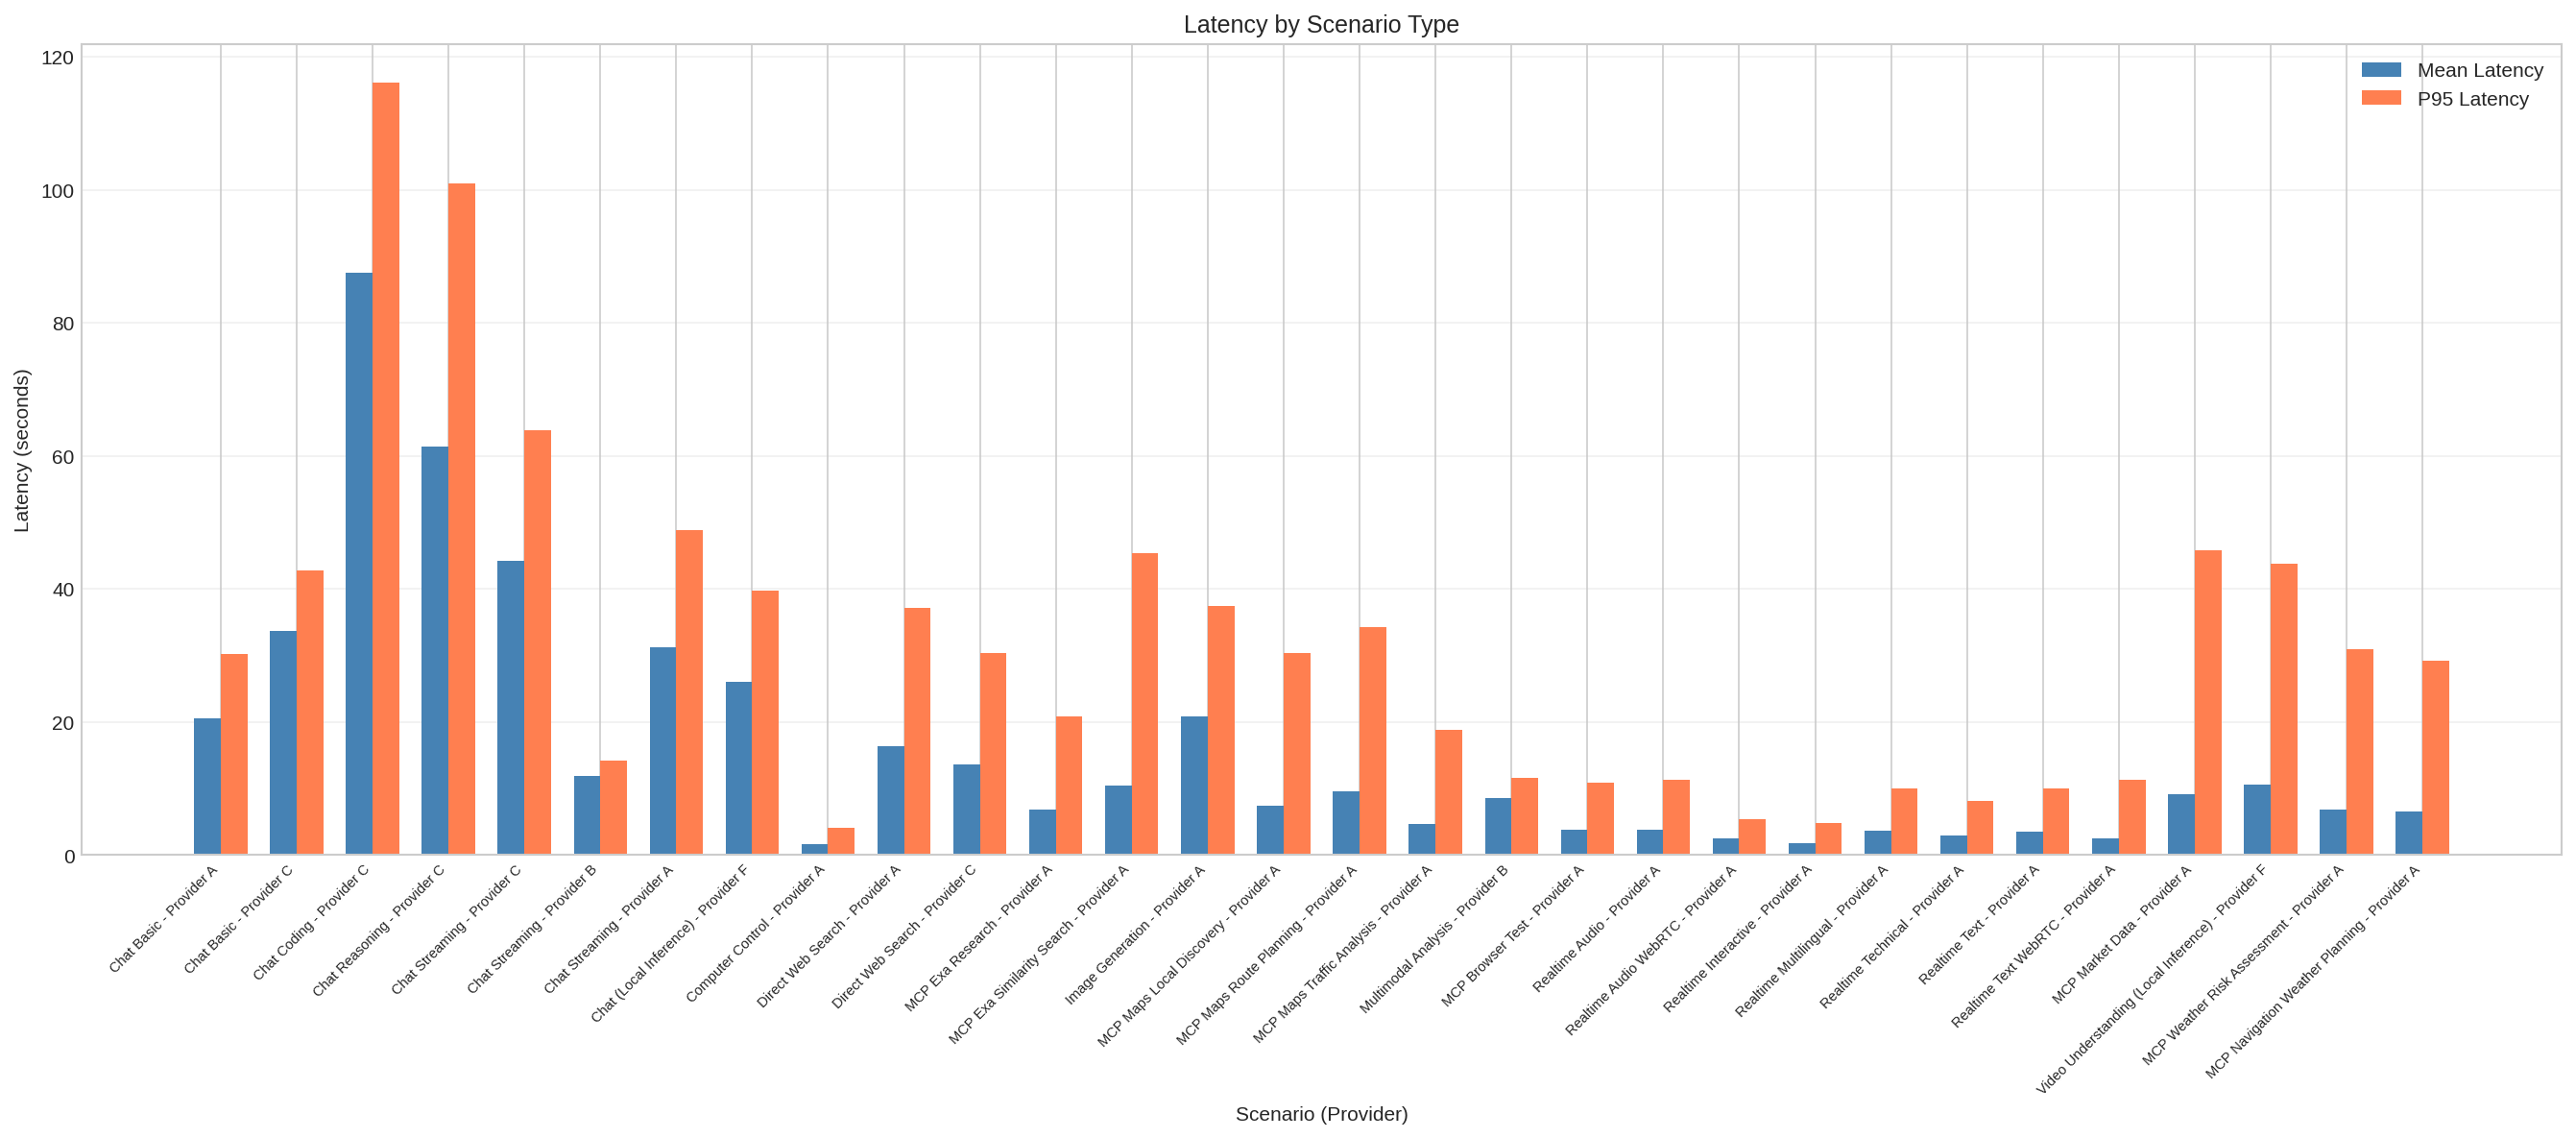
Mean and P95 end-to-end latency per scenario. Chat coding and reasoning dominate (mean up to roughly 88 s, P95 up to roughly 116 s), while real-time transports and computer-control agents complete in a few seconds or less.
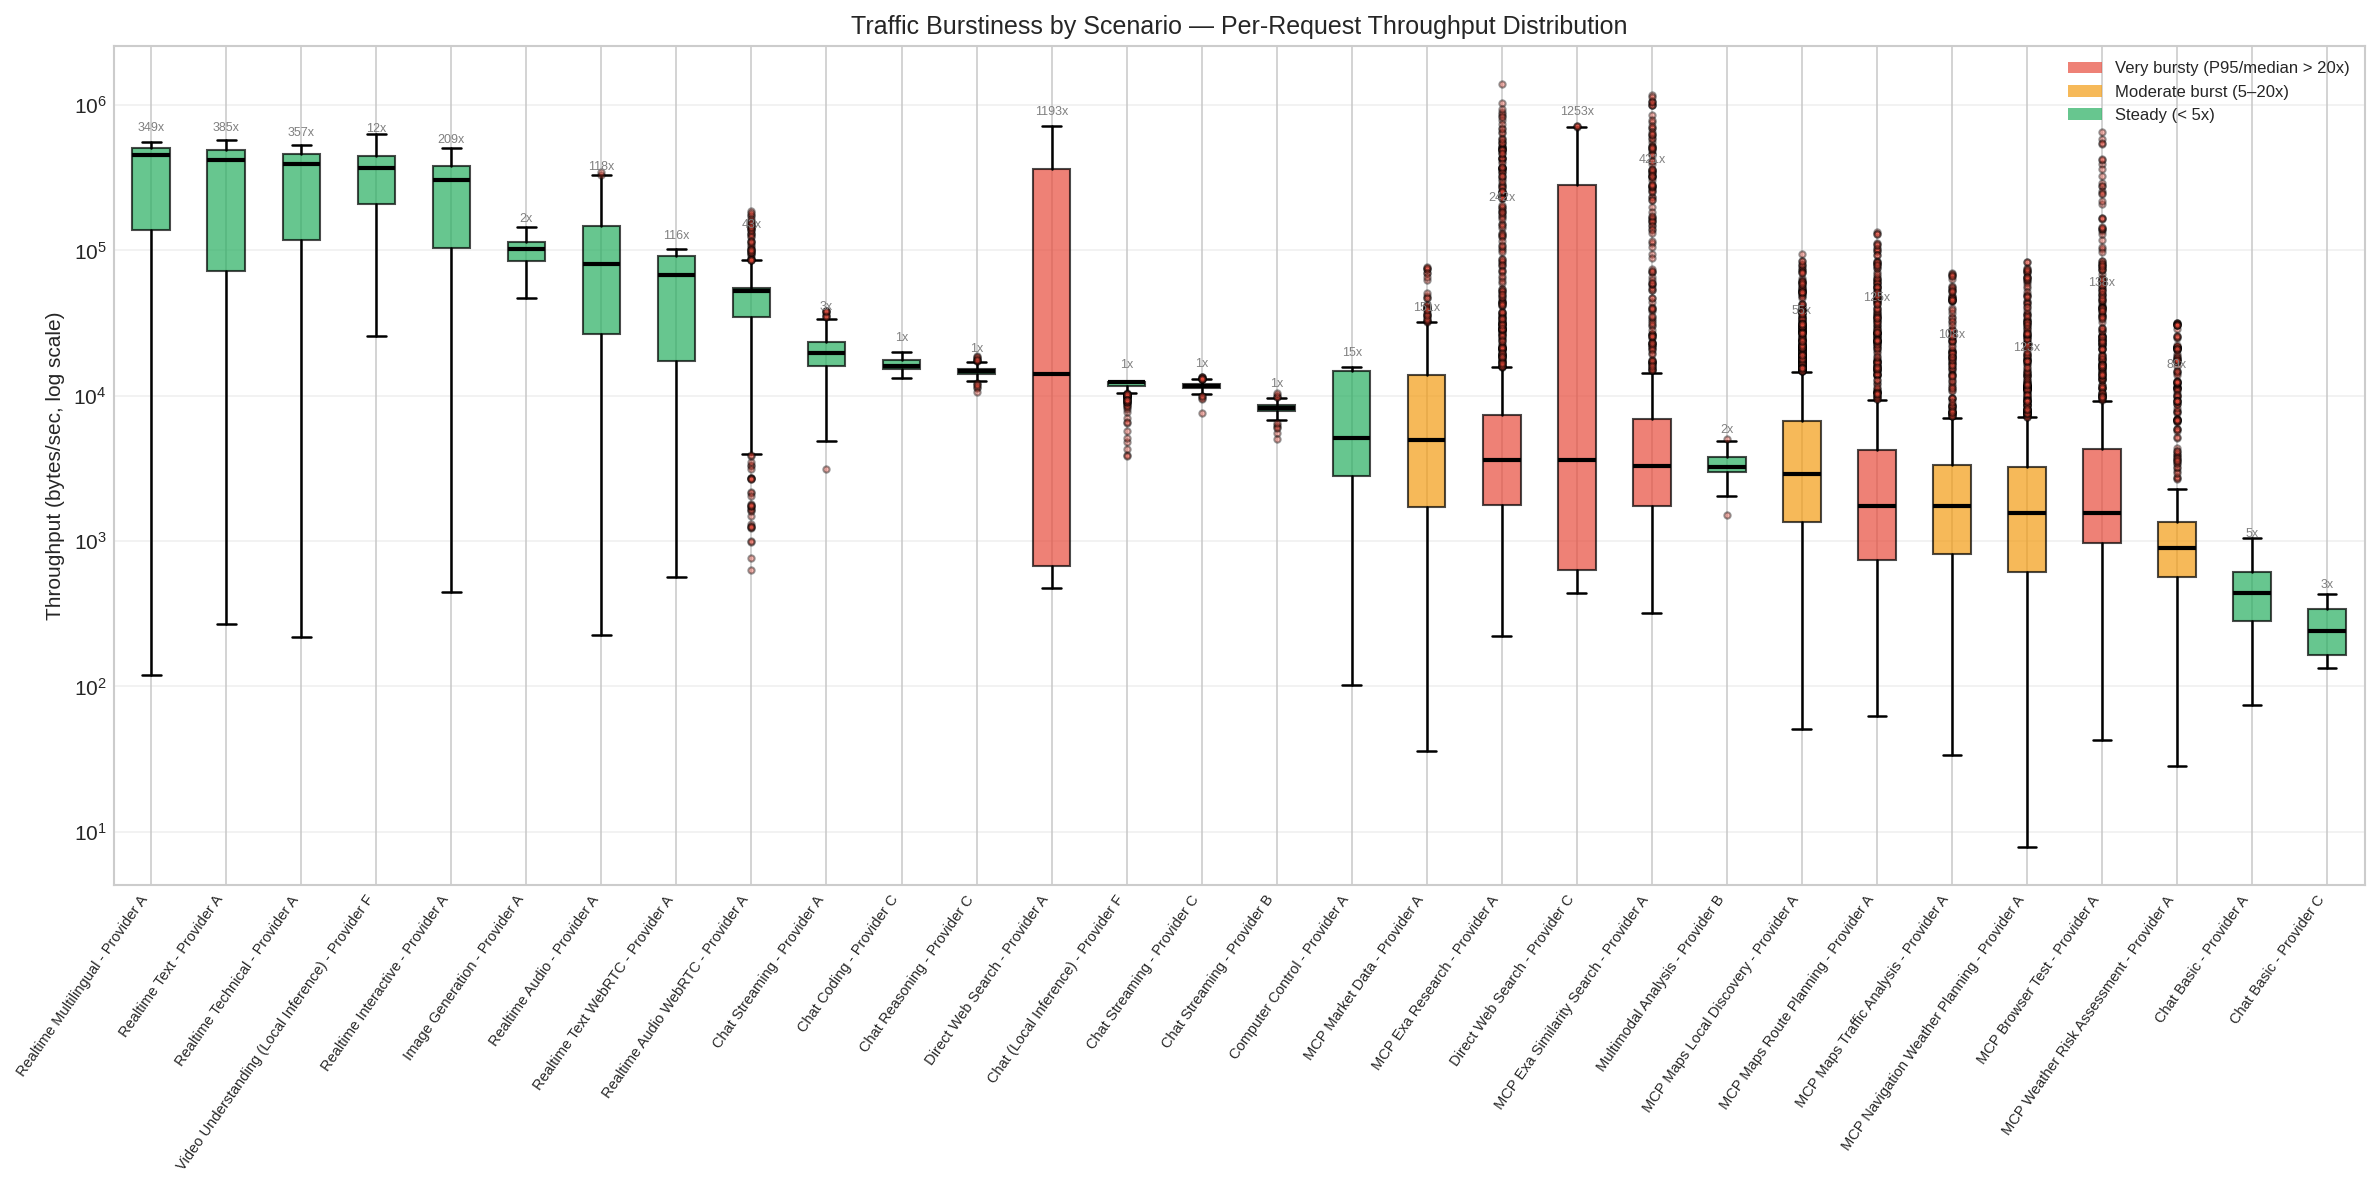
Per-request throughput distribution per scenario (log scale), classified by burstiness (P95 over median). Real-time media is steady, whereas search and agent tool calls are very bursty (P95 over median up to roughly 1250x), which stresses buffers and schedulers very differently from a steady stream.
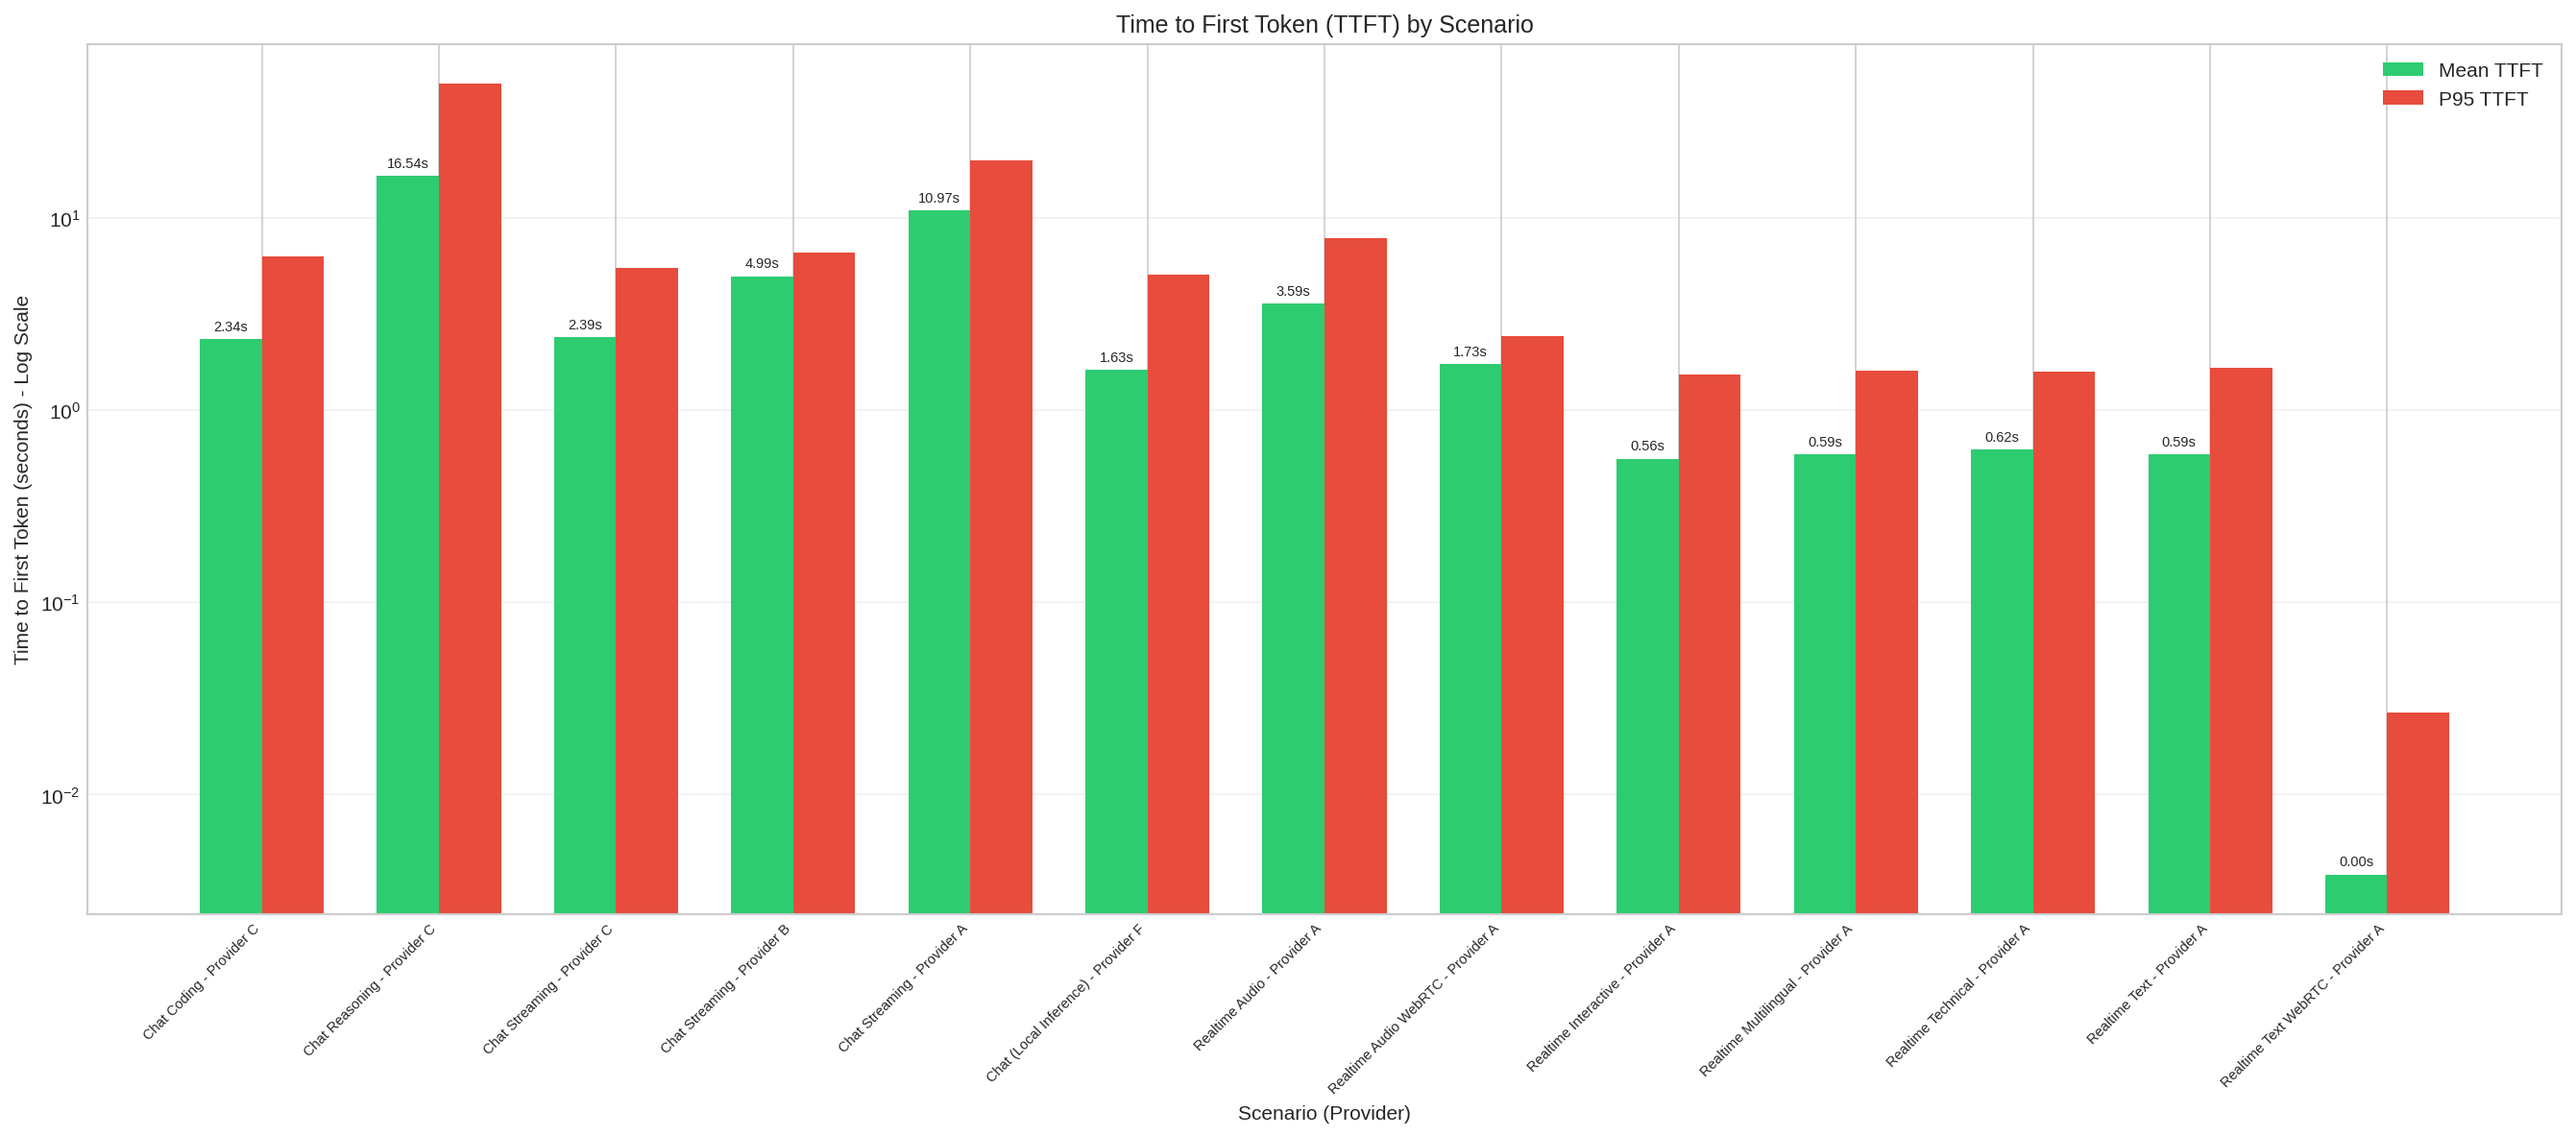
Mean and P95 time-to-first-token per scenario (log scale). Reasoning and streaming chat carry multi-second TTFT with long P95 tails, while real-time transports respond in well under a second.
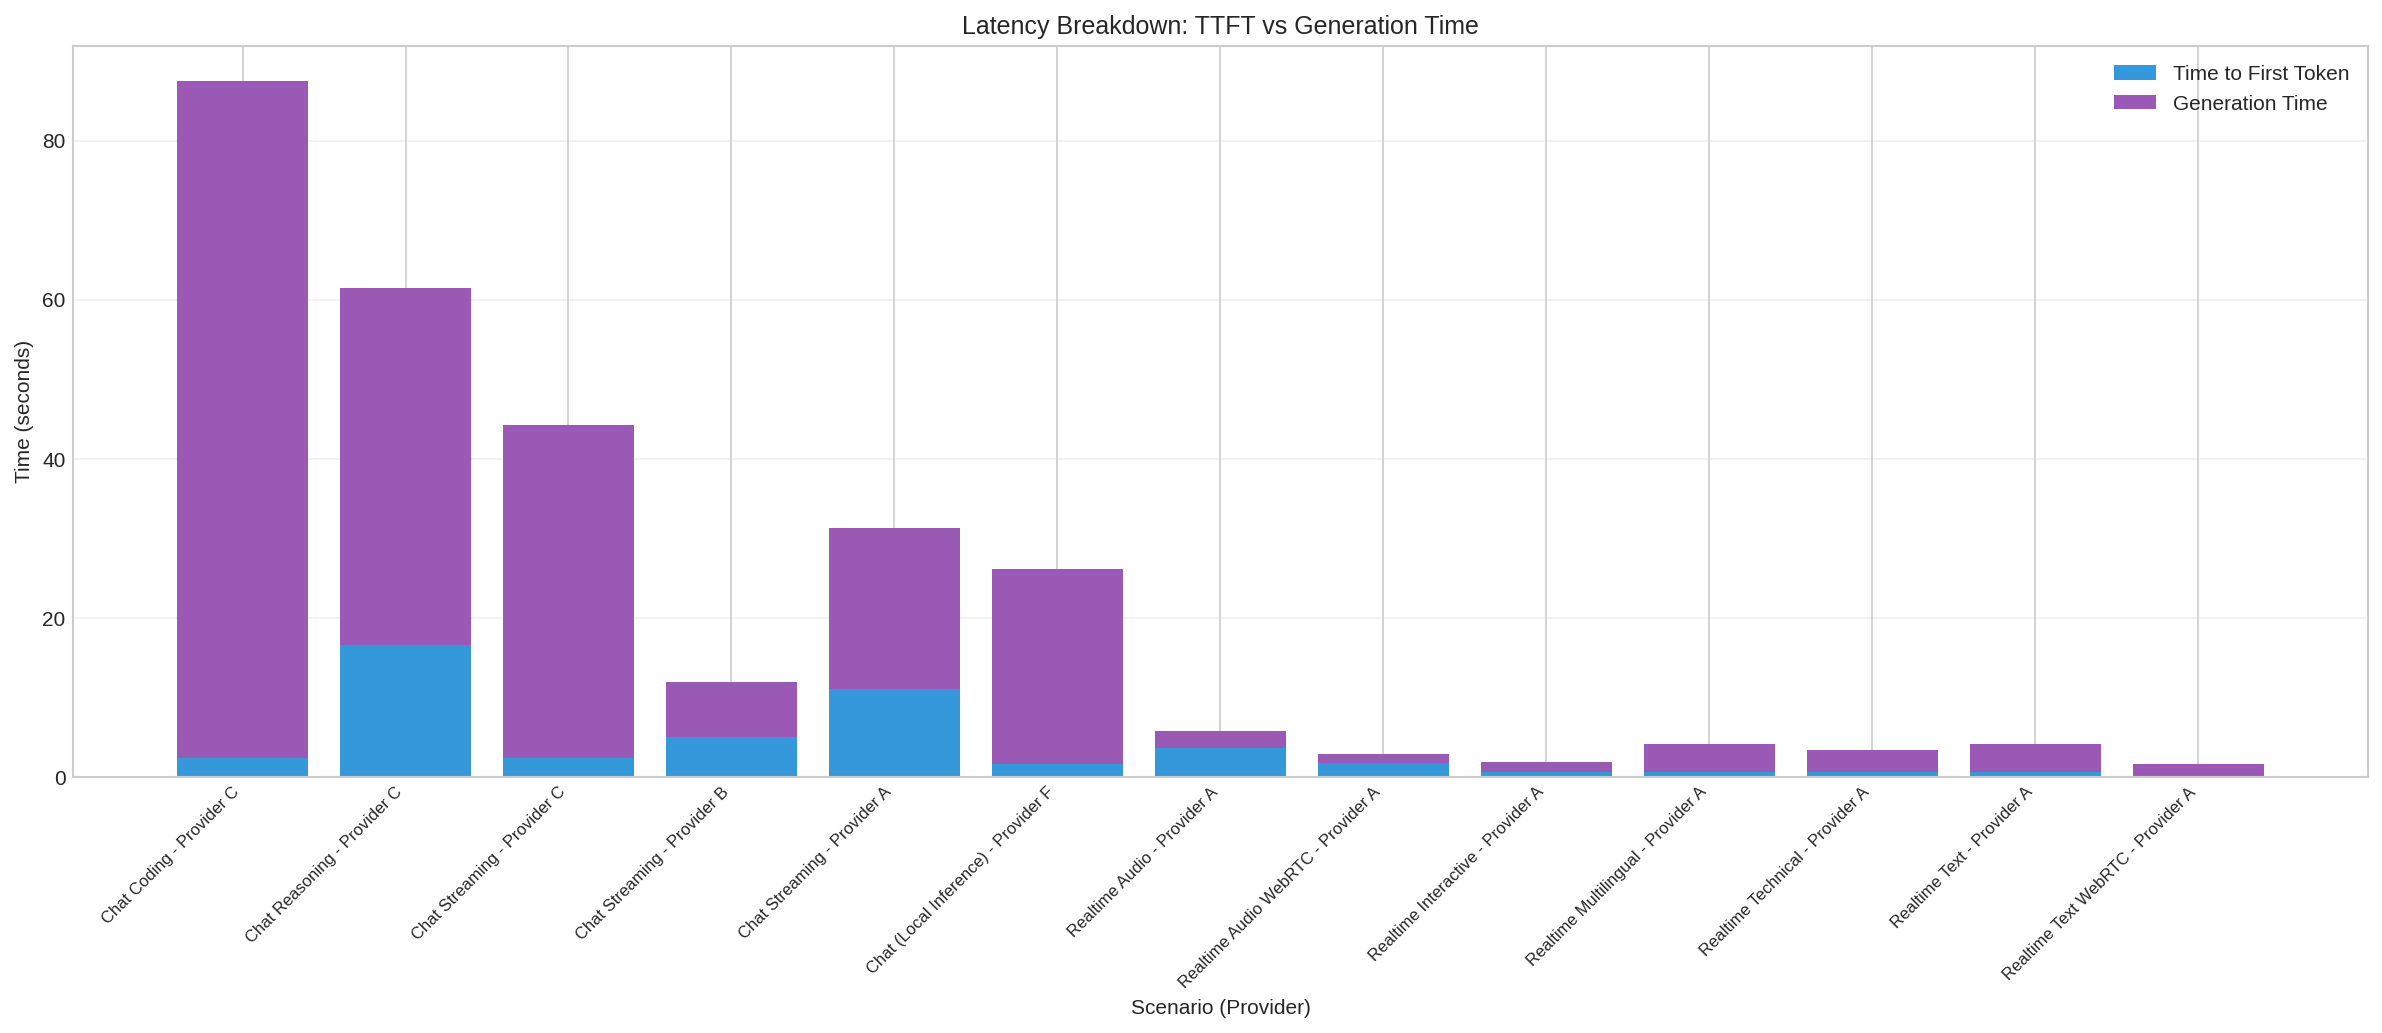
Total response time split into time-to-first-token and generation time (the path to the last token, TTLT). For chat, generation to the last token dominates the total, and TTFT is only a small fraction.
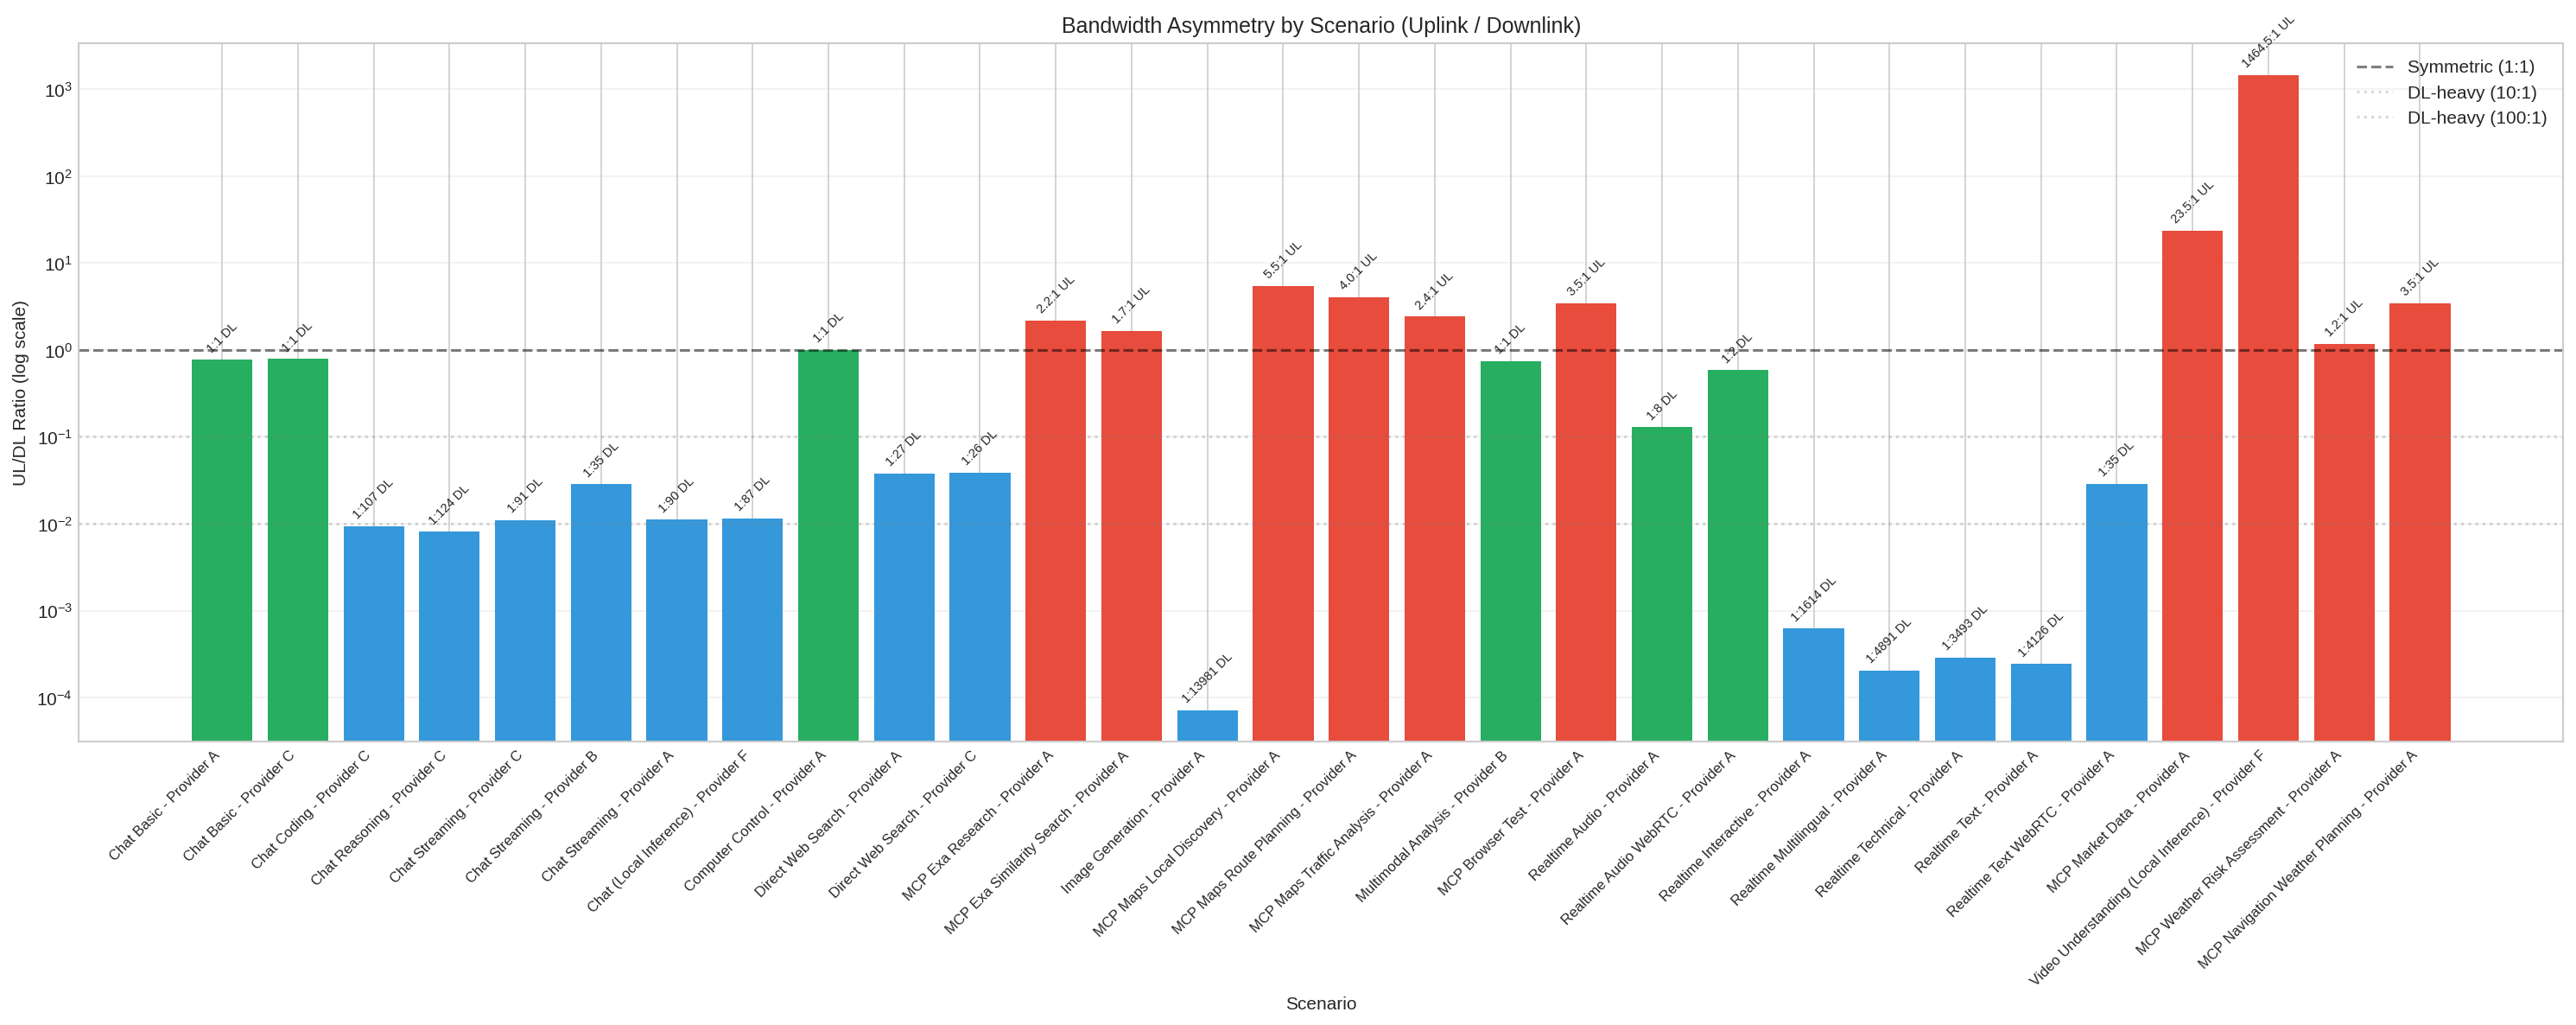
Uplink/downlink ratio per scenario on a log scale. AI traffic spans four orders of magnitude of asymmetry: image generation is extreme downlink-heavy, while video understanding and market-data tools are strongly uplink-heavy. A single directional traffic model cannot cover this range.
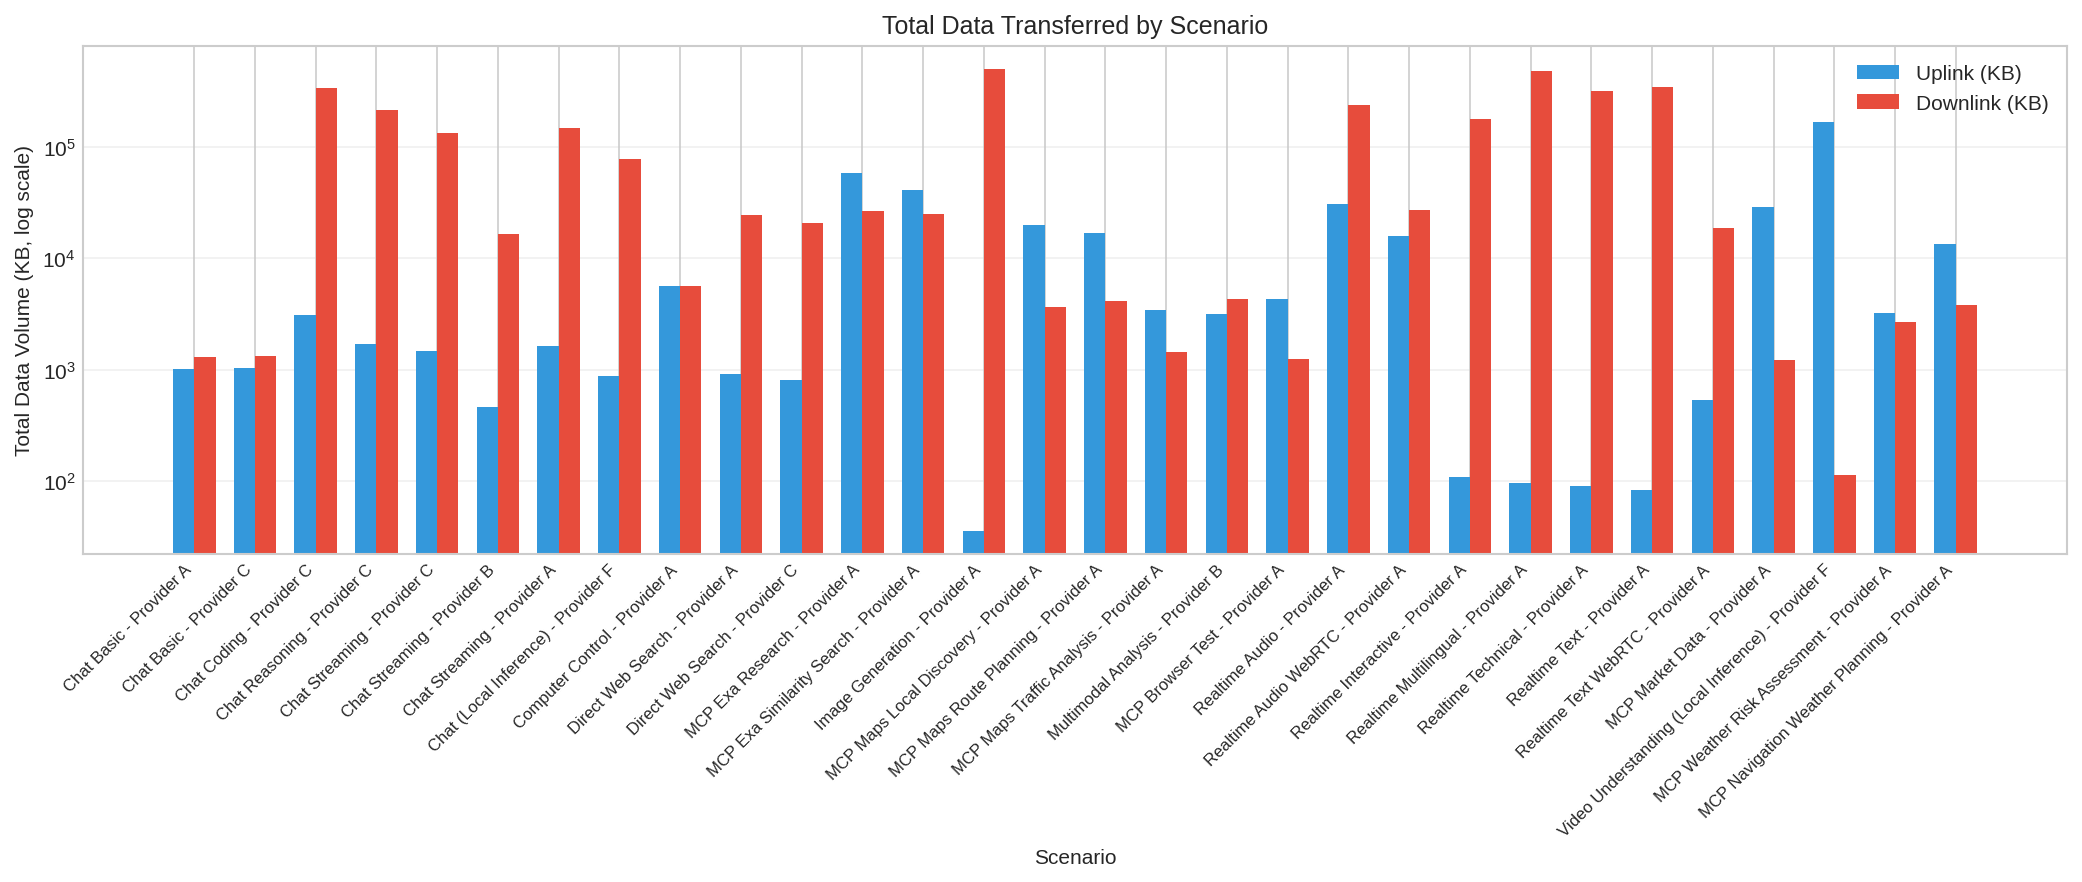
Total uplink and downlink volume per scenario (log scale). Streaming and real-time media move hundreds of KB to several MB on the downlink, whereas agent and tool calls are small and often uplink-dominated.
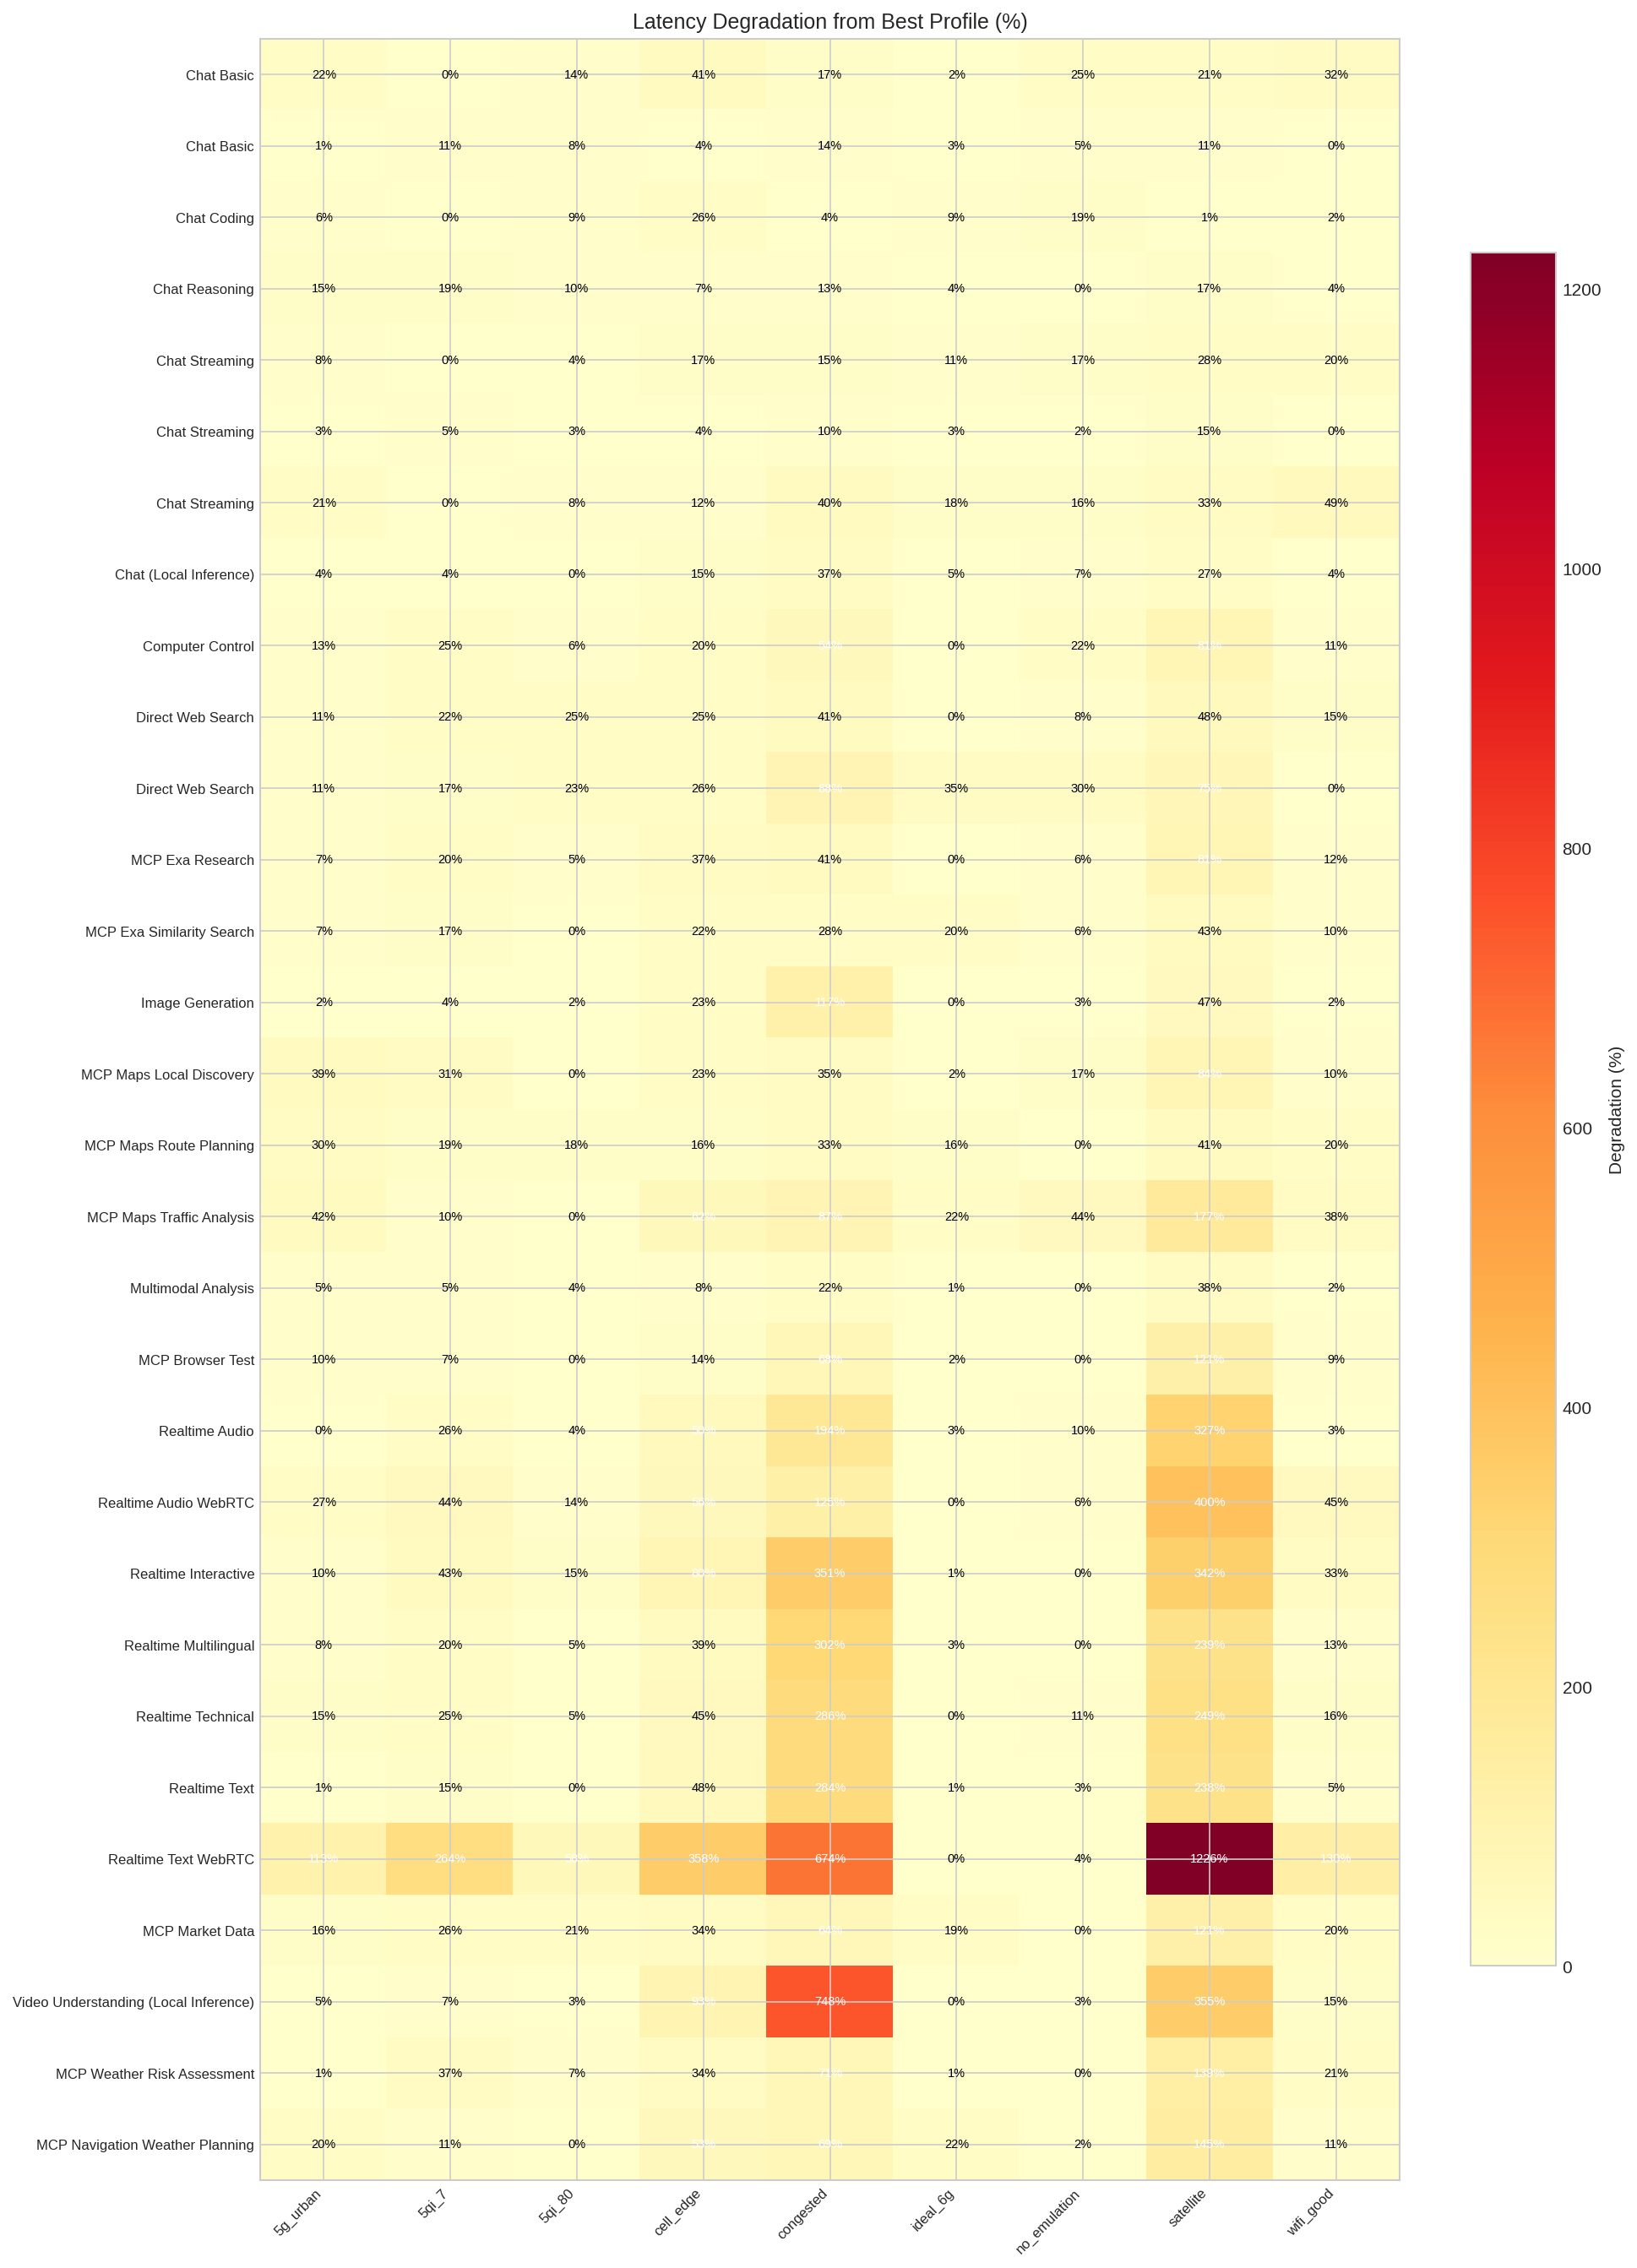
Latency degradation of each scenario relative to its best network profile. The congested and satellite columns dominate, with real-time WebRTC text and local-inference video understanding the most sensitive (hundreds of percent, up to roughly 1200%).
Cross-scenario findings
- Reliability is high except for one clear outlier. The full matrix achieved 96.5% success overall. The DeepSeek direct-search scenario produced only 10 successes in 390 attempts, including failures without emulation; excluding that scenario, the remaining matrix reached 99.4%. This pattern points to a scenario or backend integration problem rather than a network-only effect.
- AI traffic changes direction by workload. Median image-generation traffic was about 133 B up and 1.75 MB down, while video understanding on vLLM was about 1.32 MB up and 1.4 KB down. Trading and browser automation were also uplink-heavy. A single downlink-heavy traffic model is not sufficient for 6G AI scheduling.
- Streaming and real-time workloads amplify the downlink. Streaming chat returned a median 543 KB, versus 5.2 KB for basic chat. Real-time text, technical, and multilingual scenarios returned roughly 1.0 to 1.34 MB per interaction.
- Congestion affects time-to-first-token and completion differently. Streaming-chat median TTFT rose from 6.14 to 10.10 seconds, while self-hosted vLLM chat rose from 0.24 to 2.63 seconds. Real-time text completion time increased from 2.62 to 10.20 seconds, showing that token cadence and tail latency need separate treatment.
- Tool-chain reliability depends on orchestration, not only transport. In the discovery campaign, route planning, trading, and weather-risk workflows reached 100%, while shopping fell to 81.8% and Playwright to 94.7%, despite sharing the same tested profile.
Focused agent-protocol findings
- A2A signaling is latency-bound, not bandwidth-bound. On clean network profiles, a single A2A interaction took about 1.0-1.2 network RTTs. Each turn transferred only 481-565 bytes uplink and 202-943 bytes downlink, so additional bandwidth did not materially change completion time.
- Packet loss creates the failures and long tails. A2A success remained 100% across clean profiles, including a 680 ms GEO-satellite RTT. Aggregate success fell to about 95% at 1% loss and 94.6% at 3% loss. Multi-agent delegation reached 4.15-4.98 second worst cases under loss, roughly 15 times its 0.28 second clean-network baseline.
- Full agents are primarily compute-bound until the network degrades severely. The OpenClaw pipeline averaged 13.0 seconds without emulation. It remained robust at every tested profile, but mean latency rose to 22.9 seconds at cell edge and 27.2 seconds under congestion, or 2.1 times the baseline. On good links, run-to-run LLM and tool variance was larger than the network effect.
- Connection churn is a major hidden cost. A session contacted as many as eight destinations, while only 2.56% of TCP flows were reused. Median TLS setup was 970 ms and median SYN-to-application-data setup was about 1.0 second, pointing to persistent, multiplexed sessions and 0-RTT resumption as higher-value optimizations than raw capacity.
- Agent protocols add another directional pattern. Streaming A2A was 2.8:1 uplink-heavy (565 B up, 202 B down), while the full personal-assistant workload was 139:1 downlink-heavy (144 B up, about 20 KB down).
Agentic AI: where MCP and A2A struggle
Agentic workloads are the hardest case for the network, and the two dominant agent protocols, the Model Context Protocol (MCP) for tool calling and Agent2Agent (A2A) for agent-to-agent messaging, both turn a single user intent into many small, sequential, setup-heavy round-trips. The problems below are structural, not tuning issues.
MCP tool-calling: the cost is the loop, not the tool.
- The reasoning loop dominates, not the tool backend. Across MCP scenarios the measured tool-backend latency share is essentially 0% (the one exception, browser test, is 26%). The time is spent in the agent's own LLM loop: the marginal cost of one agent step is roughly 4 to 10 seconds (MCP Exa Similarity Search 9.8 s/step, Market Data 9.1 s/step, Maps Route Planning 8.8 s/step). Adding bandwidth or cutting tool latency does almost nothing.
- Call amplification. A single MCP task fans out to 15 to 20 LLM round-trips and 15 to 28 external tool calls per session (Navigation Weather Planning: 15.2 LLM + 27.6 tool calls; Maps Local Discovery: 19.6 + 21.1). Each is a separate request with its own setup and RTT.
- Sessions run for minutes. End-to-end MCP session spans reach 100 to 283 seconds (Maps Local Discovery 283 s, Navigation Weather 276 s, Exa Research 250 s): long-lived, chatty flows, not short request/response exchanges.
- Context bloat inflates every step. Conversation context grows by up to ~1,750 tokens per call (Exa Research). Because the accumulated history is re-sent on each LLM call, uplink volume and cost climb across a session even when the task does not.
- Reliability is orchestration-bound. MCP map and search flows drop to 82 to 95% success on the same profile where plain chat is 100%; the failures come from tool orchestration, not the network.
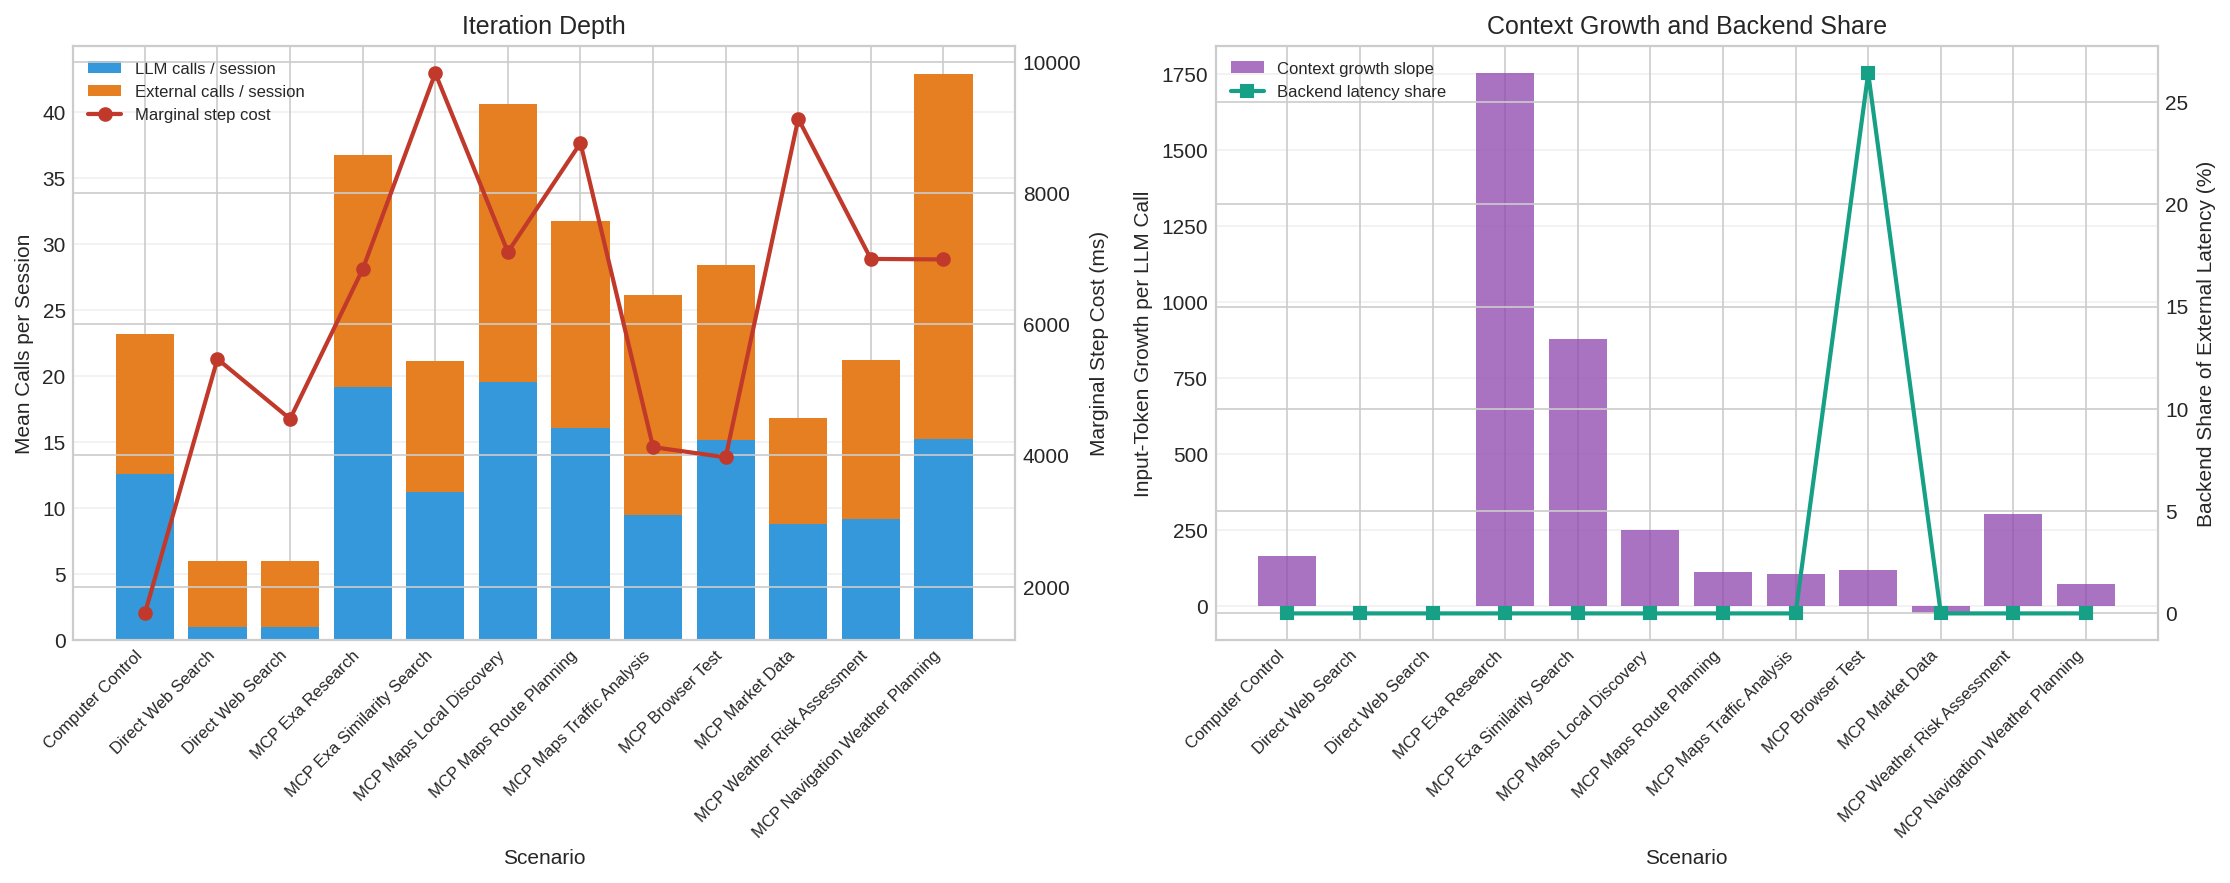
MCP agent economics per scenario. Left: LLM and external tool calls per session (bars) and the marginal cost of one agent step (line), which reaches roughly 9 to 10 seconds. Right: per-call context growth (bars, up to about 1,750 tokens per call) and the tool-backend share of latency (line), which is near 0% for every scenario except the browser test. The cost lives in the reasoning loop, not in the tools.
A2A agent-to-agent: latency- and loss-fragile signaling.
- Loss breaks it well before bandwidth does. A2A holds 100% on clean links (including a 680 ms GEO-satellite RTT) but falls to ~95% at 1% loss and 94.6% at 3% loss. Multi-agent delegation worst-case latency blows up to 4.15 to 4.98 s under loss, about 15x its 0.28 s clean baseline: small loss, large tail.
- Purely latency-bound. Each A2A turn is tiny (481 to 565 B up, 202 to 943 B down) and costs ~1.0 to 1.2 RTTs, so bandwidth is irrelevant. A distant orchestrator or an extra delegation hop adds RTTs that no amount of capacity can buy back.
- The handshake tax dominates. Only 2.56% of TCP flows are reused and median TLS setup is 970 ms, so A2A's short messages repeatedly pay a full connection setup; per-message overhead is mostly handshake, not payload.
- Delegation chains multiply hops and risk. In the current setup only the client-to-orchestrator hop is shaped and measured. A real multi-agent chain adds an RTT and a fresh loss exposure at every hop, and that per-hop scaling is still unmeasured, an open risk for standardization.
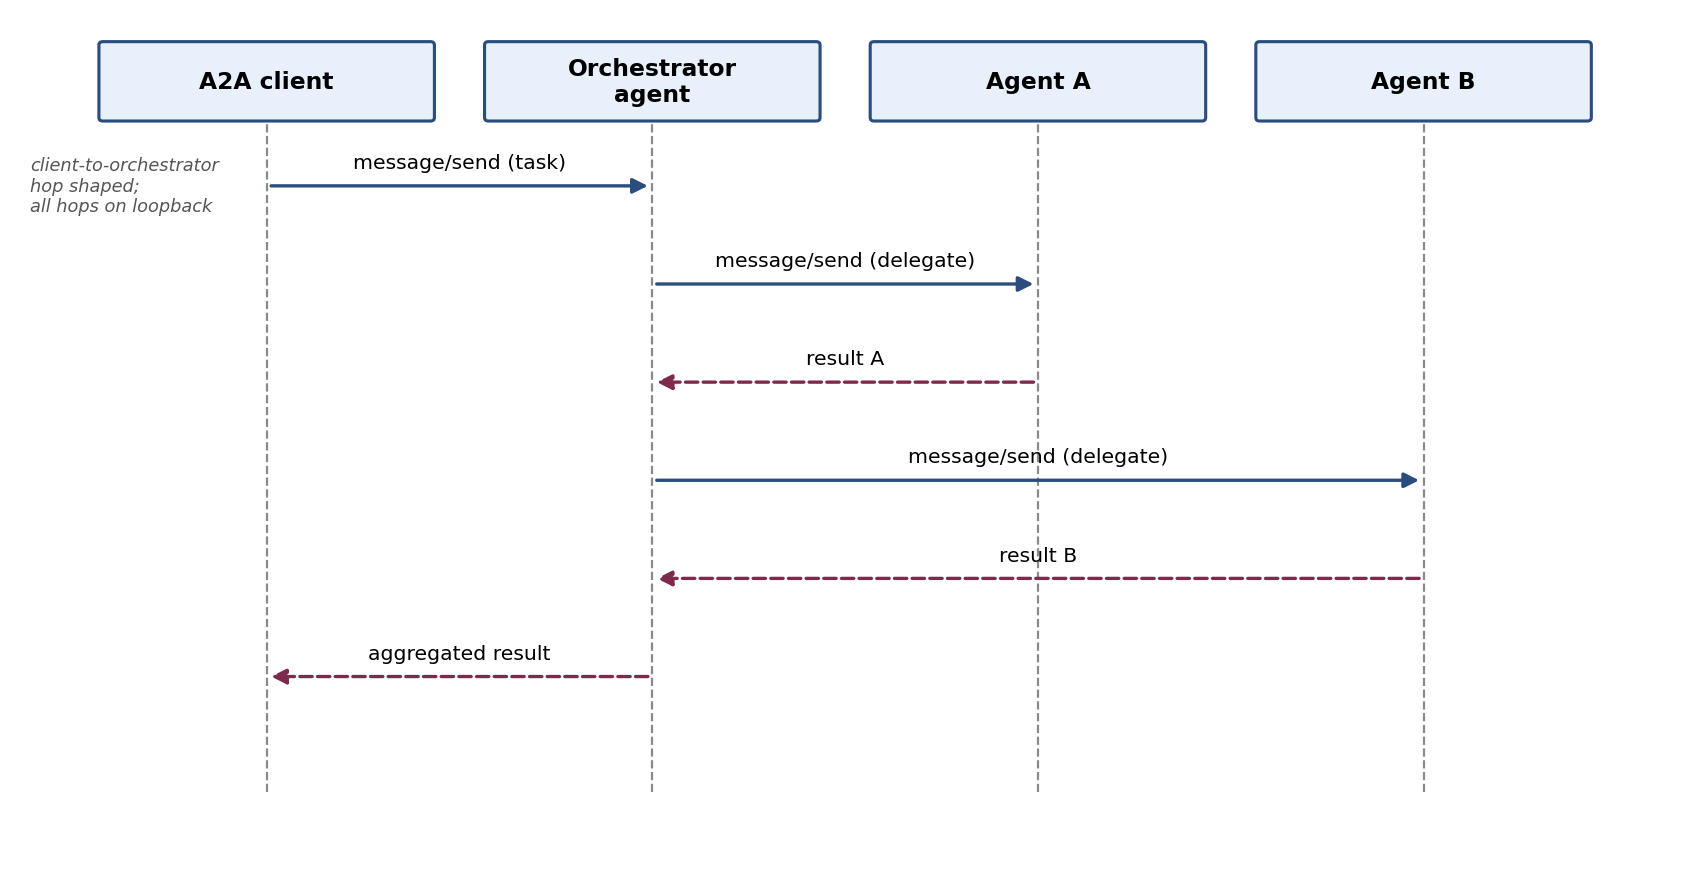
A2A multi-agent delegation. A single client task fans out into orchestrator-to-agent delegations and back, so end-to-end latency accumulates one round-trip per hop. In the current setup only the client-to-orchestrator hop is network-shaped and the agent hops run on loopback, so per-hop scaling over a real wide-area chain is not yet captured.
Common failure mode. Both protocols convert one intent into many small, sequential, setup-heavy exchanges whose cost is governed by round-trip latency, loss tails, and handshake and context overhead, not throughput. A network optimized only for bulk media bandwidth will not make agentic AI fast or reliable.
Implications for 6G design
The measurements point to five concrete system priorities:
- Define an agent-signaling service class for small messages with a low packet-error-rate target and a moderate delay budget.
- Keep discovery, brokering, and multi-agent delegation topologically close to the user so every agent hop does not cross the wide area.
- Amortize transport setup through persistent connections, multiplexing, and 0-RTT resumption.
- Treat compute and network placement as one optimization problem; once radio conditions are good, moving inference and tools closer can matter more than adding link capacity.
- Support rapidly changing uplink/downlink asymmetry and preserve streaming cadence with active queue management.
Scope. These are exploratory campaign results, not universal performance claims. The 14,355-record archive includes 1,298 raw records that were not mapped into its scenario/profile reliability aggregate. Timing, token rate, and traffic volume should be compared within a scenario because providers, models, prompts, protocols, and run counts differ across scenarios. The discovery results use one profile; the OpenClaw results use 10 runs per profile and include provider-side inference variability. OpenClaw returned a single non-streamed response, so its recorded TTFT equals completion latency. In the current multi-agent A2A setup, the shaped path is the client-to-orchestrator hop; per-hop scaling across a fully shaped delegation chain remains to be measured.
(6G, 3GPP SA4, AI/LLM, 5G-MAG, Python)